Not all states are created equal when it comes to selling final expense insurance. The best states to sell final expense have large populations of low-to-moderate income seniors, lower agent competition, affordable lead costs, and favorable demographics. This data-driven guide ranks the top states for final expense agents in 2026 and explains exactly why each market is worth your attention.
Why State Selection Matters for Final Expense
Final expense insurance is a product designed for a specific demographic: typically individuals aged 50-85 with limited income who want affordable whole life coverage ($5,000-$35,000) to cover funeral costs and small debts. The states where this demographic is most concentrated — and where agent competition is lowest — offer the highest ROI for final expense agents.
- Market size varies 10x between the largest and smallest states for final expense demand
- Lead costs vary 30-40% between the cheapest and most expensive state markets
- Competition varies dramatically: Some states have 1 licensed agent per 50 residents; others have 1 per 200
- Close rates differ by state: Cultural attitudes toward insurance, internet penetration, and phone answer rates all vary geographically
Choosing the right state — or the right states if you hold multiple licenses — can double your production without changing your skills, scripts, or lead volume.
Our Ranking Methodology
We ranked states using five weighted factors:
- Target population size (30%): Number of residents aged 50-85 with household income under $50,000 — the core final expense demographic
- Poverty rate (20%): States with higher poverty rates have more consumers who need affordable burial coverage rather than traditional life insurance
- Agent competition (20%): Licensed life insurance agents per capita — lower is better
- Lead cost (15%): Average cost per exclusive final expense web lead
- Cultural receptivity (15%): Historical close rates and phone answer rates for final expense leads in each state, based on industry data from LIMRA and InsureLeads internal performance tracking
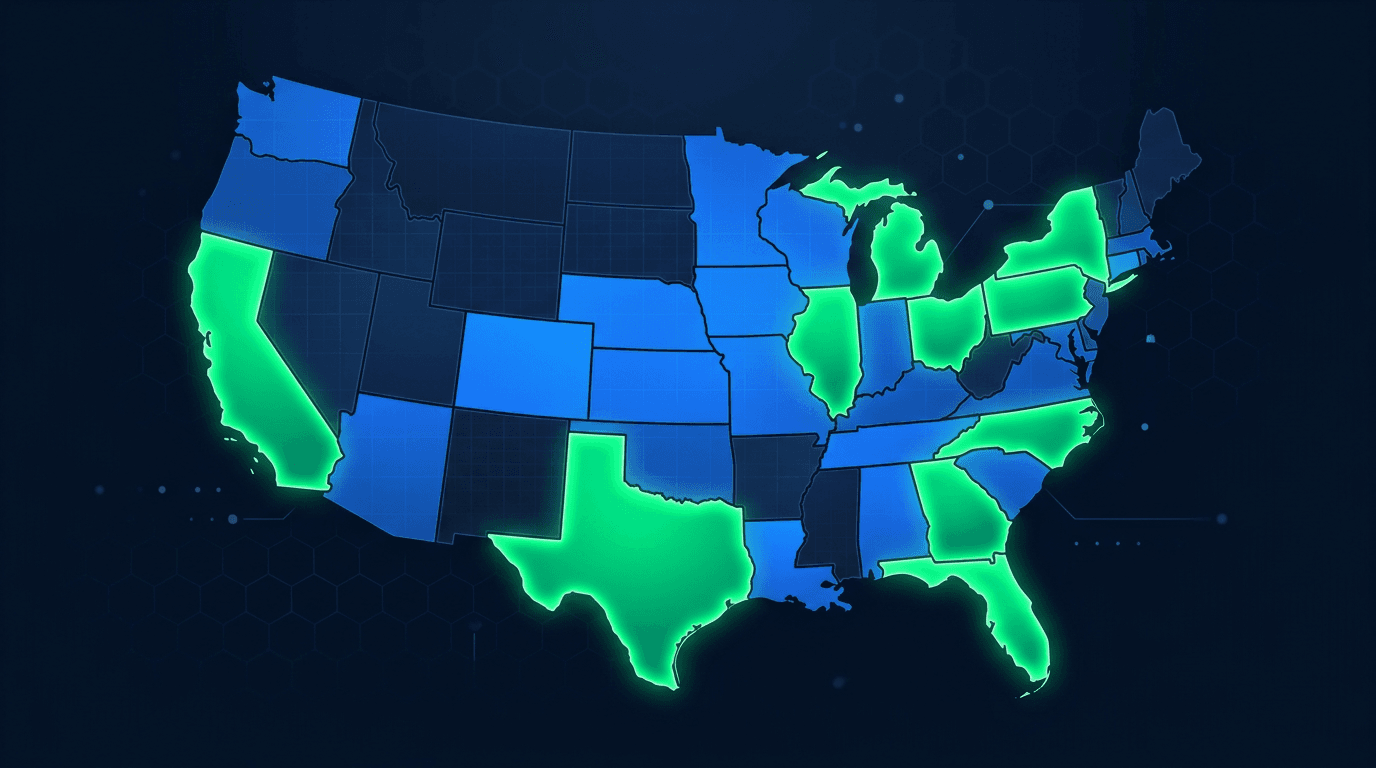
The Top 10 States for Final Expense in 2026
| Rank | State | Target Pop. | Poverty Rate | Competition | Avg. CPL | Score |
|---|---|---|---|---|---|---|
| 1 | Texas | 5.2M | 14.2% | Medium | $22 | 94 |
| 2 | Florida | 4.8M | 12.1% | High | $26 | 89 |
| 3 | Georgia | 2.1M | 13.5% | Low-Medium | $20 | 92 |
| 4 | North Carolina | 2.0M | 13.4% | Low-Medium | $20 | 91 |
| 5 | Ohio | 2.3M | 13.8% | Low | $18 | 90 |
| 6 | Mississippi | 0.7M | 19.4% | Very Low | $16 | 88 |
| 7 | Alabama | 1.0M | 16.3% | Very Low | $17 | 87 |
| 8 | South Carolina | 1.1M | 14.7% | Low | $19 | 86 |
| 9 | Tennessee | 1.4M | 13.9% | Low-Medium | $19 | 85 |
| 10 | Louisiana | 0.9M | 18.6% | Low | $18 | 84 |
Data compiled from U.S. Census Bureau poverty and population statistics, state DOI licensing records, and InsureLeads internal pricing data for Q1 2026.
State-by-State Breakdown
1. Texas — The Volume Champion
Texas ranks #1 because it combines the second-largest population with high poverty rates, especially in South Texas and rural areas. The Rio Grande Valley, East Texas, and parts of Houston have enormous final expense demand. Lead costs are below the national average, and while competition exists in DFW and Houston, rural Texas is significantly underserved. Bilingual Spanish-English agents have a massive advantage in South Texas. Browse final expense leads for Texas availability.
2. Florida — Massive Senior Market
Florida's huge 65+ population makes it a natural final expense market. The Panhandle, North Central Florida, and parts of the Gulf Coast have lower incomes and high receptivity to final expense. Competition is highest in South Florida but manageable elsewhere. Lead costs are above average but volume makes up for it.
3. Georgia — The Southeastern Sweet Spot
Georgia combines a large target population with lower competition than Texas or Florida. Metro Atlanta has high agent density, but South Georgia, Augusta, Macon, and Savannah are underserved. The state has a strong cultural receptivity to insurance — Southern families prioritize burial coverage.
4. North Carolina — Growing and Underserved
North Carolina's population is growing rapidly, particularly among retirees moving to the Piedmont and coastal areas. Rural NC has some of the lowest agent competition in the Southeast. Charlotte and Raleigh are more competitive but still accessible for agents with strong lead sources.
5. Ohio — Midwest Value Market
Ohio ranks highly because of its large target population, low agent competition, and the lowest lead costs among top-10 states. Cleveland, Cincinnati, Columbus, and the Appalachian region all have strong final expense demand. The Midwest work ethic translates to high phone answer rates and direct conversations.
Final Expense Lead Costs by State
| State | Exclusive Web | Live Transfer | Aged (30-60 day) |
|---|---|---|---|
| Texas | $18-$28 | $25-$42 | $4-$12 |
| Florida | $22-$35 | $28-$48 | $5-$14 |
| Georgia | $16-$26 | $22-$40 | $4-$10 |
| North Carolina | $16-$26 | $22-$40 | $4-$10 |
| Ohio | $14-$24 | $20-$38 | $3-$10 |
| Mississippi | $12-$22 | $18-$35 | $3-$8 |
| Alabama | $13-$23 | $18-$36 | $3-$9 |
| South Carolina | $15-$25 | $20-$38 | $4-$10 |
| Tennessee | $15-$25 | $20-$38 | $4-$10 |
| Louisiana | $14-$24 | $20-$38 | $3-$9 |
View current final expense lead pricing at our pricing page, or browse leads by state for your specific market.
Competition Analysis: Agents Per Capita
Competition density directly affects your ability to connect with prospects and close sales. Here is how the top states compare:
- Lowest competition (best for new agents): Mississippi, Alabama, West Virginia, Arkansas — fewer than 1 licensed life agent per 150 residents
- Moderate competition: Ohio, Georgia, North Carolina, Tennessee, South Carolina — 1 agent per 100-150 residents
- Higher competition: Texas, Florida — 1 agent per 75-100 residents in major metros, much lower in rural areas
The key insight: even in "high competition" states like Texas and Florida, rural areas and smaller cities offer competition levels comparable to the lowest-competition states. Geographic targeting within a state can be just as powerful as choosing between states.
Demographic Factors That Drive Final Expense Sales
Beyond population and poverty, several demographic factors predict final expense market potential:
- Low life insurance ownership rates: States in the Southeast and Appalachia have the lowest life insurance ownership rates in the nation — only 40-45% of adults have any life insurance, compared to 55-60% in the Northeast. This gap is exactly where final expense fills the need.
- Average funeral costs: The National Funeral Directors Association reports the national average funeral cost is $8,300 in 2026. In many rural Southern and Midwestern communities, families feel this cost more acutely due to lower household incomes.
- Cultural importance of burial coverage: In many Southern and African American communities, burial insurance has a long cultural history. Prospects in these communities are often more receptive to final expense conversations than in other regions.
- Internet penetration: States with lower internet penetration (Mississippi, Alabama, West Virginia) have fewer consumers researching insurance online, meaning they rely more heavily on agent outreach — which favors proactive agents buying leads.
Underserved Markets Worth Exploring
Beyond the top 10, several smaller states offer exceptional final expense opportunity relative to their size:
- West Virginia: Highest poverty rate in Appalachia, very low agent competition, and strong cultural receptivity. Small total market but extremely productive per-lead ROI.
- Arkansas: Similar to Mississippi with high poverty rates and minimal agent competition. Lead costs are among the lowest in the nation.
- Kentucky: Appalachian Eastern Kentucky is severely underserved. Louisville and Lexington have moderate competition, but rural areas are wide open.
- New Mexico: High poverty rates, large Native American and Hispanic populations, and very low agent competition. Bilingual agents thrive here.
- Indiana: Often overlooked, Indiana has a large blue-collar population with moderate incomes and strong final expense demand, especially in Southern Indiana and Gary/South Bend.
Frequently Asked Questions
Can I sell final expense in states where I do not live?
Yes. Most states offer non-resident insurance licenses that allow you to sell remotely. Apply through each state's Department of Insurance. Processing typically takes 2-4 weeks. Some agents hold licenses in 10-15 states to maximize their territory.
What is the average final expense commission?
First-year commissions typically range from 80-110% of the annual premium. On a $50/month ($600/year) policy, that is $480-$660 in first-year commission. Renewals are typically 5-10% annually for 7-10 years, adding $30-$60 per year per policy in passive income.
Should I focus on one state or sell in multiple states?
Start with one or two states to build expertise and refine your scripts. Once you are consistently profitable, add 2-3 states at a time. The agents with the highest volume typically sell in 5-10 states simultaneously, using non-resident licenses and geographic scheduling to cover multiple time zones efficiently.
What is the best lead type for final expense?
Exclusive web leads and live transfers produce the best close rates (8-15% and 15-25% respectively). Aged leads are excellent for volume dialing at lower cost. Facebook leads are increasingly popular but require strong follow-up systems due to lower initial intent. The best approach is blending 2-3 lead types.
How many final expense leads do I need per day?
For phone-based final expense sales, aim for 15-25 leads per day (mix of fresh and aged). This typically produces 30-50 dials, 8-12 conversations, and 1-3 applications. Agents writing 10+ policies per week usually work 20+ leads daily with a power dialer.
Start selling in the most profitable final expense markets. Browse InsureLeads final expense leads by state, or view pricing for volume packages tailored to multi-state agents.